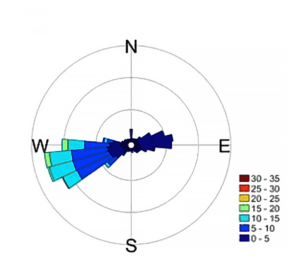
A new study will help responders plan for the effects of weather on an oil spill. Dr. Rob Campbell, a researcher at the Prince William Sound Science Center, has been working with the Council to collect data about ocean currents, wind direction and speed, wave direction and heights, and other information from two buoys in Prince William Sound.
The buoys have been in place since 2019, and have collected enough information to begin to analyze trends. Dr. Campbell recently analyzed the nearly two million pieces of information.
Dr. Campbell found that the air and water temperatures generally followed a typical annual cycle for a subarctic region. Highest temperatures were seen in August, and the lowest in February. There were a few deviations, however:
- During the summers of 2019 and 2020, the region experienced a marine heatwave, referred to by locals as “The Blob.” These unusually warm temperatures matched what was occurring in the Gulf of Alaska.
- Late 2020 brought impacts from a La Nina event. La Nina is a climate pattern associated with cooler temperatures in the Pacific Ocean.
Regional temperatures increasing
Temperature data has been collected in the region since 1908. Dr. Campbell was able to compare this historical data with data from the buoys to confirm a warming trend of approximately 5 degrees Fahrenheit over the last 114 years.
Surface temperatures trending warmer in winter, cooler in summer
Interestingly, in the last few years Port Valdez has experienced cooler than average temperatures at the water’s surface during summer. This appears to be related to melting glaciers, which have been melting much faster in the Gulf of Alaska region than the rest of the world. Most of this melting happens between May and October. Cold water from the Lowe River and Valdez Glacier Stream flows into the port, cooling the water’s surface.
How does this affect oil spill prevention and response?
Understanding how factors such as wind, waves, currents, and temperatures are behaving and changing can help responders better prepare for an oil spill, and make sure spill contingency plans are tailored to real conditions in the region. Real-time weather data can also provide valuable information during a spill response.
Full report:
Find more details about the analyses in Dr. Campbell’s report: Port Valdez Weather Buoy Analysis 2019 – 2023